Why does Greenland look so big on maps? (And how big it really is)
On the Mercator projection, the most familiar world map, areas swell the farther they are from the equator. That is why Greenland looks as big as Africa, which is actually 14 times larger.
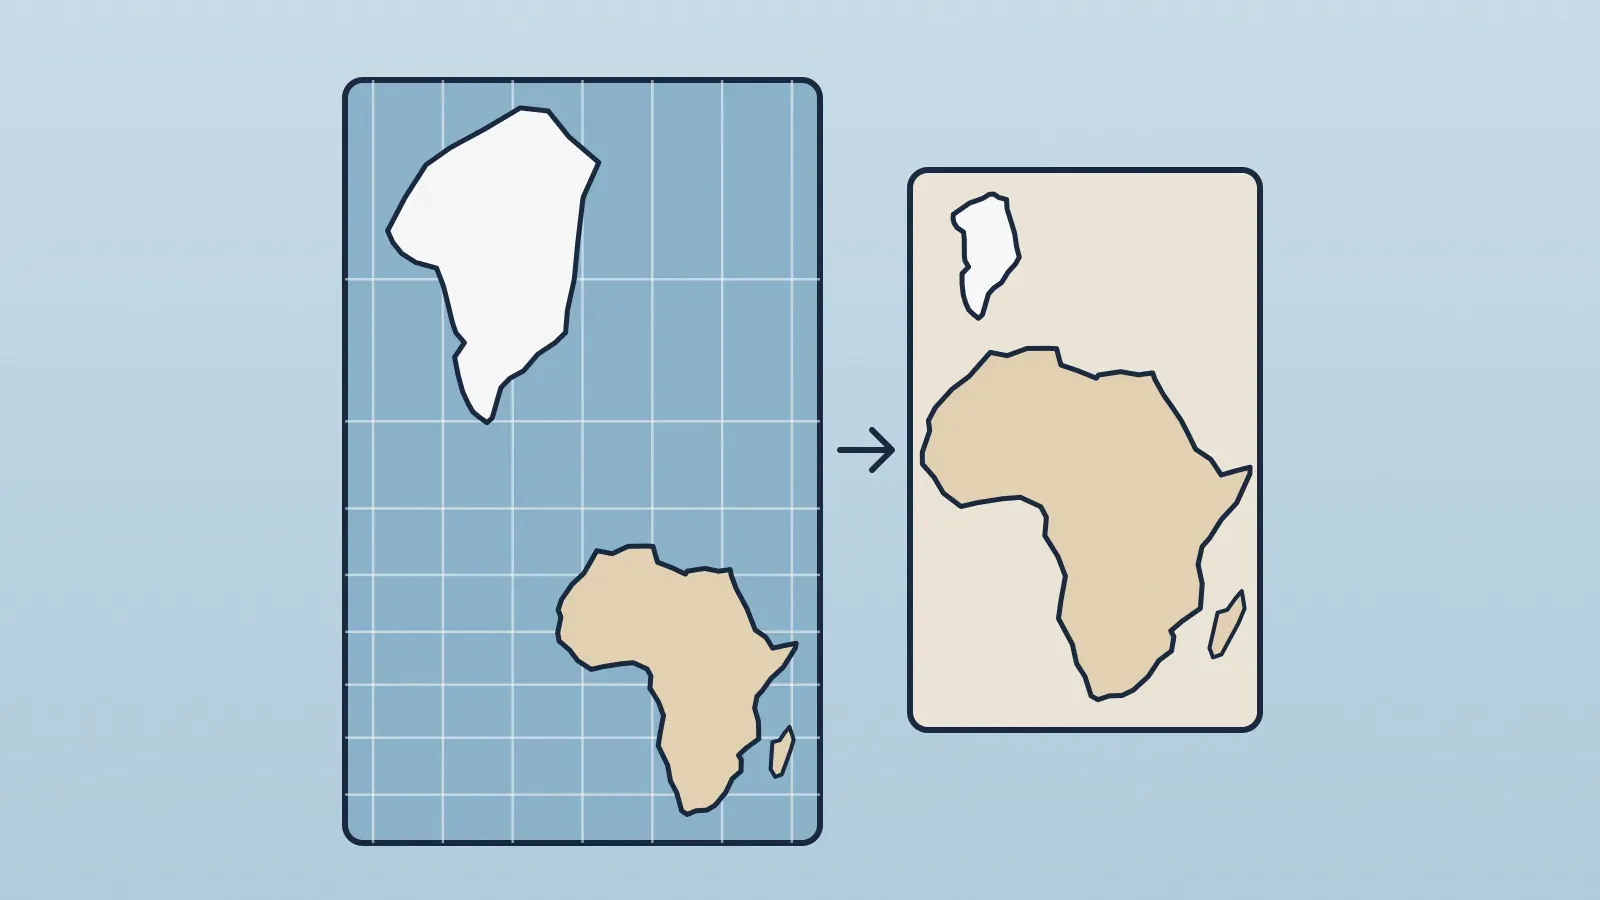
Greenland looks huge because most world maps use the Mercator projection, designed in 1569 for navigation. To keep angles correct, it stretches regions near the poles. On the map, the island looks about as big as Africa, yet the African continent is roughly 14 times larger.
What is a map projection, anyway?
Earth is nearly a sphere, and there is no way to flatten a sphere without tearing or distorting something. Try pressing an orange peel flat on a table: it splits or stretches. A map projection is the mathematical rule that decides how each point on the globe lands on paper, and therefore what gets distorted.
The U.S. Geological Survey (USGS) sums up the dilemma: every flat map misrepresents Earth's surface in some way. Each projection chooses what to preserve among directions, distances, areas and shapes, and none can preserve them all at once.
Why does Mercator stretch the polar regions?
Flemish cartographer Gerardus Mercator designed his projection with sailors in mind. Meridians and parallels are straight lines meeting at right angles, and any straight line drawn on the map is a constant compass bearing. For a 16th-century navigator that was gold: draw a line from port to port with a ruler and hold that heading.
The price is steep. On a globe, meridians converge until they meet at the poles. On a Mercator map they stay parallel, so everything far from the equator gets stretched sideways. To keep angles true, the projection stretches it vertically by the same amount. Shapes look right over small areas, but sizes balloon toward the poles.
- At the equator, scale is true: Africa barely inflates.
- At 60 degrees latitude, distances double and areas look 4 times bigger.
- At 70 degrees, areas look more than 8 times bigger.
- At 80 degrees, more than 30 times.
- At the poles, the enlargement would be infinite, which is why Mercator maps cut off the top and bottom of the world.
Those figures come straight from the projection's geometry: the area enlargement grows with the inverse square of the cosine of latitude. Since almost all of Greenland lies north of 60° N, it is among the most inflated landmasses on the map.
How big is Greenland compared with Africa?
On a Mercator map the two seem evenly matched. On a globe the gap is obvious: according to educational material from the National Geographic Society, Africa is about 14 times larger than Greenland. Greenland is still the world's largest island, but nowhere near continent-sized, which is also part of the story of why Australia is a continent and Greenland an island.
The same distortion hits other high-latitude places. Canada, Russia, Scandinavia and Alaska look much bigger than they are, while countries near the equator, such as those in central Africa, Brazil and Indonesia, appear close to true scale. Antarctica, when it shows up at all, becomes an enormous white band along the bottom.
If it distorts so much, why do we still use Mercator?
Because it is still excellent at what it was built for: direction. The USGS notes that it is the only map on which a straight line drawn anywhere shows a true direction. And because it preserves angles well, streets and city blocks don't skew when you zoom in. That is why online map services such as Google Maps and ArcGIS Online use a variation of it, the same kind of map behind the apps that use GPS to plot your route.
The trouble starts when the projection is hung on a classroom wall to show the whole world, as if its areas were real. For that job, there are alternatives.
Which projections show true sizes?
Equal-area projections keep every region's relative size but distort shapes and directions. The best known is the Gall-Peters, which Boston Public Schools adopted for classroom maps in 2017. It gets areas right but leaves continents such as Africa visibly elongated and squeezed.
In response to that news, cartographers Tom Patterson, Bernhard Jenny and Bojan Šavrič created the Equal Earth projection, published in 2018. It also preserves areas, but with rounded edges and less stretched shapes. Then there are compromise projections, which get nothing perfect but little badly wrong, such as the Robinson and the Winkel Tripel, which National Geographic adopted for its reference world maps in the 1990s.
Next time you see a world map on a wall, look for Greenland first. Its size gives away, at a glance, which projection the mapmaker chose and what they decided to sacrifice.